Introduction: The Market’s Hidden Rhythm
Markets often look random, but beneath the surface, they move in rhythm. That rhythm is reflected in the Fibonacci sequence, which traders have used for decades to identify retracements and profit zones.
When combined with analytics — moving averages, candlestick patterns, and volume — Fibonacci becomes a powerful tool. With RevCan, traders can spot these confluences faster, turning theory into actionable strategy.
Fibonacci Retracements: Buying Dips, Selling Rallies
Retracement levels like 38.2%, 50%, and 61.8% often act as magnet zones where price pauses or reverses. For example:
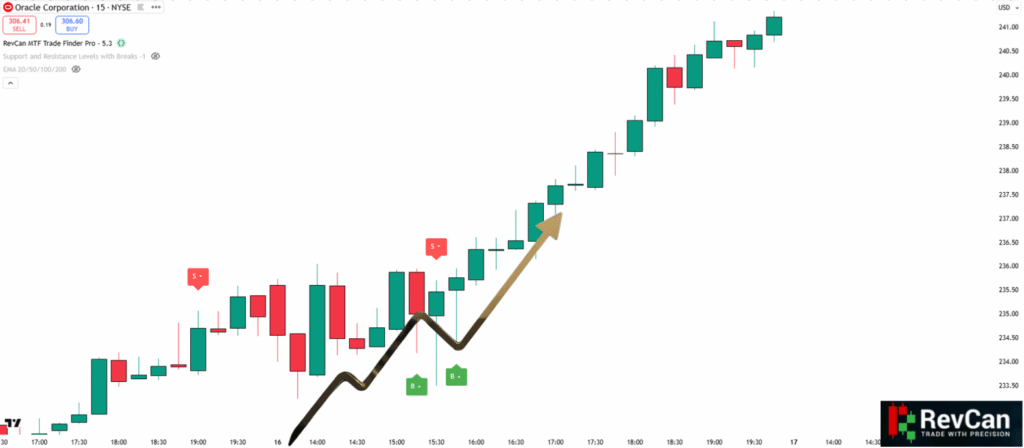
- In uptrends, a 61.8% pullback with bullish confirmation = strong buying opportunity.
- In downtrends, a 38.2% retracement rejecting resistance = potential short entry.
Smart traders don’t just trade Fibonacci blindly. They look for confluence: candlestick patterns + volume + moving averages.
RevCan enhances this process by alerting traders when valid swings occur at or near Fibonacci levels.
Fibonacci Expansions: Smarter Profit Targets
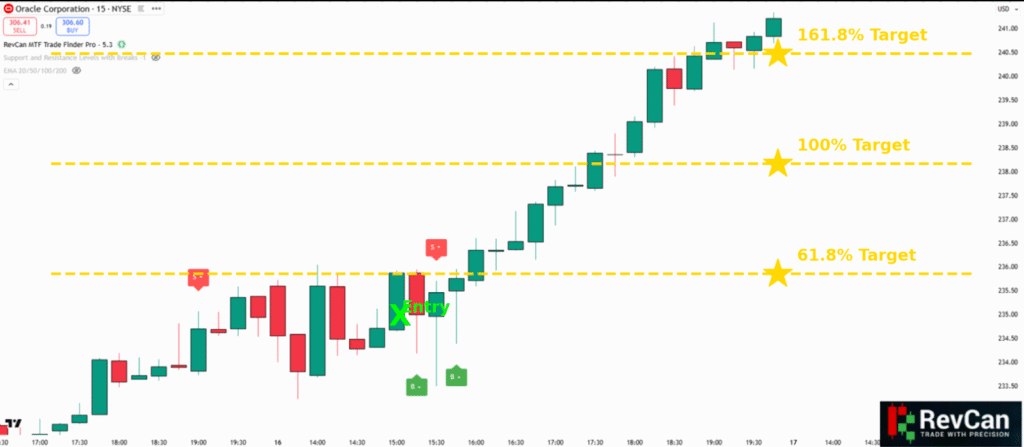
Where to take profits? Fibonacci expansion levels give guidance:
- 61.8% = conservative.
- 100% = neutral.
- 161.8% = aggressive, trend-riding.
Pairing expansions with indicators like RSI or volume spikes can confirm when momentum supports extended targets. RevCan further strengthens this by highlighting expansions aligned with validated swing points.
Common Fibonacci Mistakes
- Overloading charts with too many levels.
- Ignoring broader trend direction.
- Trading without candlestick confirmation.
- Forgetting risk management.
Analytics — moving averages, candlestick patterns, and RevCan — ensure Fibonacci isn’t used in isolation.

Conclusion
Fibonacci is not a magic bullet — but combined with confluence and analytics, it’s one of the most powerful tools in trading. RevCan helps traders pinpoint Fibonacci levels that matter most, turning rhythm into actionable opportunity.
👉 Unlock the market’s hidden rhythm with analytics and RevCan at revcan.io.